|
We spend much of our time dealing with the handout from last Friday, Ideal Gas Model Factors. We will finish these problems tomorrow. Also tomorrow, we will have more to say about the Maxwell-Boltzmann speed distribution for the ideal gas model. It has to do with how many particles are moving at a given speed. The distribution shows us what the most common speed is for particles in a gas at a certain temperature. You should also be aware of how the distribution curve changes as the temperature of a sample of gas is raised or lowered. 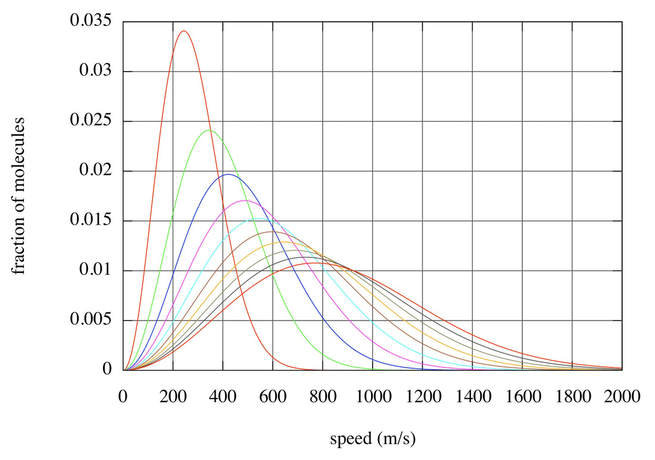 The plot above shows the distributions of the speeds of gas particles for a sample of gas at different temperatures. Which plot is for the sample of gas at its highest temperature? Why do the plots become shorter and wider as the temperature of this gas sample increases?
Assignment:
Comments are closed.
|
Physics IIMr. Swackhamer Archives
May 2019
Categories |
| Mr Swackhamer's Classes |
|
- Home
- About
- Contact
- Physics I
- Physics II
-
Earth Science
- Earth Science Blog
- Earth Science Chapter 1
- Earth Science Chapter 2
- Earth Science Chapter 3
- Earth Science Chapter 4
- Earth Science Chapter 5
- Earth Science Chapter 6
- Earth Science Chapter 7
- Earth Science Chapter 8
- Earth Science Chapter 9
- Earth Science Chapter 10
- Earth Science Chapter 11
- Earth Science Chapter 12
- Earth Science Chapter 13
- Earth Science Chapter 14
- Earth Science Chapter 15
- Earth Science Chapter 16
- Earth Science Chapter 17
- Earth Science Chapter 18
- Earth Science Chapter 19
- Earth Science Chapter 20
- Earth Science Chapter 21
 RSS Feed
